

Making sure Travis always runs smoothly all the time has become one of our most important tasks over the recent weeks and months. As a distributed system, there are a lot of moving parts, and we’re putting more and more eyes on every single piece to make sure they do their job. Obviously there’s no need to keep this a secret, so let’s talk about some recent changes to Travis’ infrastructure.
Case in point. A recent deployment broke updating profiles temporarily. Here’s a pretty graph showing pretty much the exact point in time when we deployed and the spike in the number of errors.
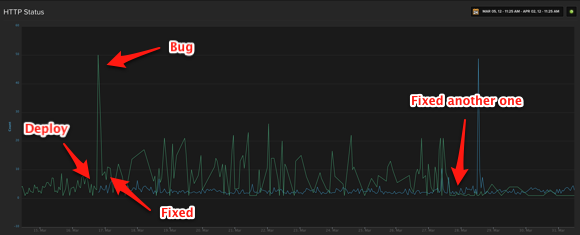
You can see the initial spike, which represents a sudden increase in application errors. We rolled out a fix shortly after, so things quieted down somewhat. There’s still some noise though, still several 500 errors popping up in our logs. It took a while to fix those, but you can see it eventually ebbed off after another deployment.
This is a pretty powerful tool. We added more and more metrics on the moving parts in Travis. If you want to know why, you should read this blog post from the Flickr engineering team, and you should definitely watch Coda Hale’s talk Metrics, Metrics Everywhere!.
All these metrics tell us what’s going on inside Travis in real time, and they show us historical growth so we can spot patterns, capacity issues and unexpected spikes. Here’s a another pretty graph of all our internal notifications. These metrics are pretty new and were put in production last Friday, but it’s still something to enjoy (click to enlarge).

All these pretty graphs are courtesy of Librato Metrics, who were kind enough to offer sponsoring their service for Travis CI. As we add more and more metrics to Travis they’ll automatically show up in Librato and will be graphed in real time.
The fun doesn’t stop there. To make it possible that we can properly graph 404 and 500 errors, we added custom logging. Rails’ default logging is not very helpful for production systems, as it produces a lot of noise. Thanks to Rails 3 and the new notifications introduced with it, it’s now possible to override what Rails does by default and hook in your own logging. That’s exactly what we did, and the result is lograge, a little library that turns Rails’ logging events into a neat, single line per request. You can read all about it in Mathias’ blog post.
This helped streamline our logging, making it more and more useful along the way. All our logs are aggregated in Papertrail, who were also kind enough to offer sponsoring their services for Travis.
This allowed us to do something pretty nifty.
Eric of Papertrail wrote a neat little metrics
library for Ruby called Metriks, which we
started using in Travis. It collects metrics and can dump them to either a log
file or directly export to Librato Metrics or
Graphite. It can also show selected metrics in
the process status, so whenever you run ps ax, you can see the current number
of requests per second, or pretty much whatever you fancy. You should go and
read Eric’s blog post on the
library.
The really neat bit is that Metriks can log the collected metrics to the log file. Papertrail can then look for patterns in the aggregated logs and react accordingly, in this case triggering a webhook where the metrics are aggregated and eventually stored in Librato Metrics. Did that just blow your mind?
Here’s how that looks coming into Papertrail (click to enlarge).
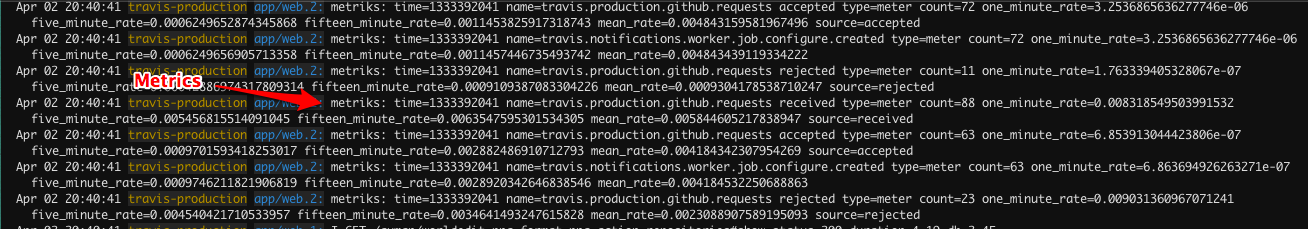
This little trick utilizes Papertrail’s filters and webhooks alerts, and a nifty little app that Eric built to accept the filtered output when a metric is found in the logs.
Why would we want to do that? Simply because it decouples the fact that we’re collecting from where the metrics need to be stored. It’s a fully asynchronous process, and they’ll simply show up in Librato eventually. We can also put a filter on anything in Papertrail and have occurrences in the log be directly graphed in Librato’s Metrics. It’s pretty awesome. Every bug fixed is a new opportunity to add more graphs and add more logging.
For good measure, here’s another graph showing the requests we’re receiving from GitHub. It includes the received, accepted and rejected pushes.

The beautiful bit is that we can take any metric and correlate it with others. That’s a pretty powerful tool to find problems in infrastructure.
This is far from all of it, but it’s a start. If you want to know more about why Mathias is so obsessed with metrics and monitoring, you should read his blog post about it. See you in the next installment about how we’re adding more mustache to Travis’ infrastructure.