

Travis has a history of failure. While we’re not ashamed to admit that and talk about them in public, we’re also working hard to ensure that we notice early on if something breaks. We want to find out about it before our users do.
Over the last couple of months we’ve added a ton of metrics to improve insight into all parts of Travis. But during these months, we couldn’t find the single metric that would tell us if the system is doing what it’s supposed to do, which is of course to run your builds. It took us quite a while to finally figure out how to measure something that doesn’t happen. That caused me quite a headache, even though, in hindsight, it was so obvious.
Just last week, we had three unavailabilities due to networking issues on EC2 and two DDoS attacks on GitHub. Earlier this week, EC2 crapped out once again, taking part of our infrastructure with it.
There was a difference with all these outages. Even though there wasn’t much we could do about them, this time we were alerted about them well in advance. Fun fact: we found and added the metric that defines whether or not Travis is running properly. As embarrassing as they were for us, at least we knew about them when they were happening.
Enough blabber, what’s the metric already? After getting repeatedly notified by users that builds are not being run, it finally hit me one day. The simplest metric that we can track that shows us how the system is doing is the time since the last build started.
Yes, it turns out to be that simple. Turns out that this it the sole defining metric that helps us keep a watchful eye on Travis. Just to be safe, we added the time since the last build finished. As a general metric we’re also tracking the number of message currently ready to be consumed in RabbitMQ. These metrics give us a rough clue that something is failing in our infrastructure. Here’s a recent snapshot of what they look like when correlated:

Here’s a more recent graph that shows a database latency spike not long ago and queues backing up as a consequence. We’re still investigating why this happened, and we’ll move to a bigger database setup soon as well. We’re also spreading out the work load even more to keep up with it better.

How can I find my soul metric?
Why did this take so long to figure out? The most common question I get from folks is what kinds of metrics they’re supposed to track for their application.
Unfortunately, there is no obvious answer here. If you have a simple web application, your most common nominator is the number of web requests, and the response time.
If you have an app that sends a lot of email, your metrics could be the amount of email being sent, time of an email spent in the delivery queue, time of network requests to remote email servers, file system utilization. Your core metric would probably still be the numbers of email sent. If email is being sent, the system is in a nominal state. If no email is sent, something is likely to be wrong. Add the number of emails waiting in the queue and you have data to correlate with.
Sometimes your core metric just isn’t obvious in the first place. For us, the metric only became obvious after we realized that what users would mostly report to us is that there haven’t been any builds running for several hours.
In Travis, every component has its own core metrics. For instance, we have a process that processes the build logs. From above, the most important metric is the number of log messages waiting to be processed. To be able to track this, we recently started collecting more detailed metrics for every single queue in RabbitMQ.
On Tuesday morning, when EC2 was still having issues, we noticed that log processing was way behind. Thankfully, we had a second metric in place to track the averages and 95th percentiles of ActiveRecord updates. Lo and behold, the 95th percentile for these went through the roof, up to 6 seconds for a single write to the database. Another fun fact: the metrics for single queues was just added the day before. In fact, I put them in production when the troubles started and our alerts immediately went off. Here’s something visual that shows the latency spiking and the number of messages queueing up in our logging queues as a result:
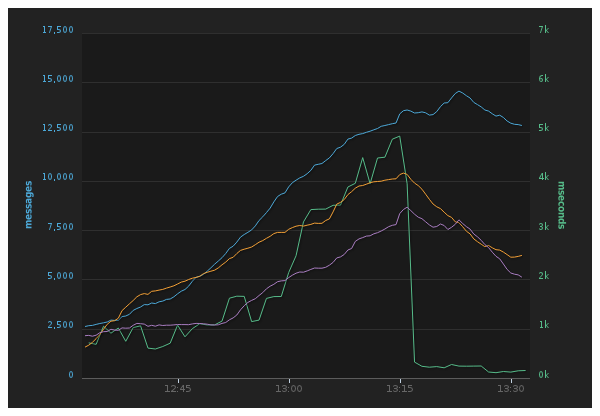
Notice the latency going up (green graph) and messages piling up. Suddenly the latency went back to almost being normal, and the queues were slowly drained.
Finding your soul metric can take time. But in the end, it boils down to what matters most to your users. What’s most valuable to them can easily turn into exactly what you need to track to figure out if, from the user’s point of view, everything is still working.
Tell me about your monitoring and alerting?
Our infrastructure is still mostly based on what I wrote about earlier this year, with a few additions.
To track custom, external metrics like the ones from RabbitMQ or determined by database updates, we built a small monitoring app based on Celluloid. It polls data sources every 20 seconds and pushes them directly to Librato Metrics.
As these metrics are critical to running the platform, a resolution of 20 seconds is pretty good, though we might take them further down to 10 seconds in the future.
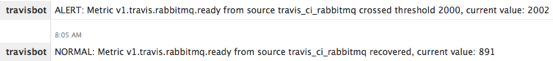
That little app also does threshold-based alerting to our Campfire room. I’m planning on adding support for Pagerduty and Prowl soon too.
While there are existing tools for monitoring, metrics collection and alerting, there’s no shame in experimenting with your own, if you’re aware of the downsides. Monitoring mostly still sucks, to get better, more people need to play with more ideas.
If you want to chat monitoring and metrics, Travis or coffee, I’ll be in NYC next week for devopsdays.