

Last week, we shipped official support for PostgreSQL 9.2 and 9.3 on Travis CI.
In the weeks leading up to the announcements, just in time, we finished up some long overdue upgrades of our own infrastructure, bringing Travis CI up to par with the latest versions of PostgreSQL.
For the longest time, Travis CI ran off a single PostgreSQL instance, posing a challenge for us to both scale up and out. Due to unfortunate timing, we’ve been running on a 32 bit server with 1.7 GB of memory.
This limited our upgrade options, as we couldn’t just bring up a new follower in 64 bit mode based on the archived data of a 32 bit machine. We had to do a full export and import as part of the migration. This was one of the reasons why we held off on this upgrade for so long. Initial estimates pointed to a downtime of almost an entire day.
Amazingly, this single box held up quite nicely, but the load on it, mostly due to several hundred writes per second, bogged down the user experience significantly, making for slow API calls and sluggish responses in the user interface. We’d like to apologize for this bad experience, these upgrades were long overdue.
First the good news: the upgrades brought a significant speed boost. We upgraded to a bigger server, a 7.5 GB instance, and we upgraded to the latest PostgreSQL version, 9.3.1.
Here’s a little preview (and an unexpected cameo appearance) about the results:

This graph is the accumulated response time of all our important API endpoints in the 95th percentile.
Just in time for our planned upgrades, Heroku shipped their new Heroku Postgres 2.0, with some new features relevant to our interests.
Two Steps Forward
While travis-ci.com was already running on PostgreSQL 9.1, travis-ci.org was still running on 9.0.
We had one major problem to solve before we could approach the upgrade. Most of the data we carry around are build logs. For open source projects, as much as 136 of the 160 GB total database size was attributed to build logs.
Due to their nature, build logs are only interesting for a limited amount of time. We implemented features to continuously archive and load build logs to S3 a while ago.
But before the upgrade, we had to doubly make sure that everything was uploaded and purged properly, as we’d abandon the database afterwards, starting with a clean slate for build logs.
Once this was out and done, we migrated the logs database first. It only consists of two tables, and with all logs purged, only a little bit of data remained to be exported and imported.
All migrations took the better of four hours each, an unfortunate but urgently need service disruption. We kept the maintenance windows mostly to the weekends as much as we could to reduce overall impact.
The Results
We were pretty surprised by the results, to say the least.
Let’s look at a graph showing API response times during the week when we migrated two databases for travis-ci.org.
The first step happened on Wednesday, November 13. We moved build logs out of the main database and into a set of Tengu instances with high availability.

You can see the downtime and the improvements in the graph above. Overall time spent waiting for the database in our API went down significantly after we upgraded to a bigger instance, notable after the second set of red lines, which marks the migration of our main data to a bigger setup. A great result.
Here’s a graph of the most popular queries in our systems:
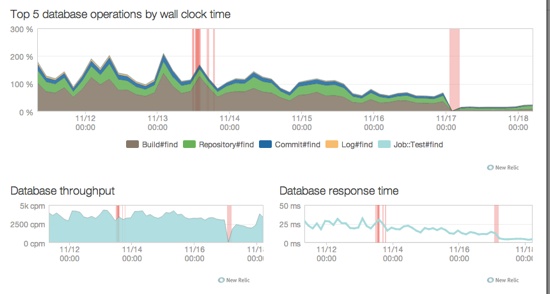
What you’ll also notice is that after the first migration, the averages are smoother than before, less spikey. Times overall initially didn’t really change significantly, but we removed a big load from our main database with this first step.
After the second migration, the most popular queries went down dramatically, almost dropping on the floor.
Here’s the breakdown on what was previously the most expensive query in our system:

Average call time went pretty much flat after the upgrade from a very spikey call time with lots of variation, suggesting much more expensive queries in the higher percentiles.
We can attribute that to much better cache utilization. Cache hit rates for indexes went up from 0.85 to 0.999, same for table hits, which is now at 0.999 as well.
Thanks to much more detailed statistics and Datascope, we now get much better insight into what our database is up to, so we can tune more queries for more speedups.
Unexpected Benefits
PostgreSQL 9.3 brought a significant feature, the ability to fetch data from indexes.
We saw the impact of this immediately. The scheduling code that searches for and schedules runnable jobs, has been a problem child as of late, mostly in terms of speed.
During peak hours, running a full schedule took dozens of seconds, sometimes even minutes. We analyzed the queries involved, and a lot of time was spent fetching data with what PostgreSQL calls a heap scan.
This turned out to be very expensive, and the lack of caching memory added the potential for lots of random disk seeks.
With PostgreSQL 9.3, a single scheduling run, which used to take up to 600 seconds, now takes less than one, even during busy hours.
A great combination of useful new features and lots more available cache memory gave us some unexpected leg room for build scheduling. We still need to tackle it, but now have less urgency.
Unexpected Problems
After the migration of travis-ci.com, we noticed something curious. Build logs for new jobs wouldn’t load, at all.
We quickly noticed a missing preparation step in the migration: check for any joins that could be affected by having two separate databases.
The query behaviour on travis-ci.com is slightly different compared to the open source version. We explicitly check access permissions to protect private repositories from unauthorized access.
This check broke for log, as the permissions check is currently joined into the query. As we’re working on doing more explicit permissions checks rather than join in the permissions, it worked out well to fix this minor issue on the spot and remind ourselves that we need to tackle the overarching issue soon.
Travis CI is now running on a total of eight database servers, four in total to store build logs, two for both platforms, and two Premium Ika for serving the main data for API, job scheduling, and all the other components. While eight may sound like a lot, four of those are failover followers.
We hope you enjoy a faster Travis CI experience. We still have lots more tuning to do, but even for bigger projects like Mozilla’s Gaia, with currently more than 21000 builds, the build history loads almost instantly.
If you haven’t already, check out Heroku’s new PostgreSQL. We’ve been happy users, and we’re very lucky to have such great people on their team to help us out.
Also, be sure to subscribe to PostgreSQL Weekly, curated by Craig Kerstiens, who also has a lot of great content about PostgreSQL published on his blog.