Travis has a history of failure. While we’re not ashamed to admit that and talk
about them in public, we’re also working hard to ensure that we notice early on if
something breaks. We want to find out about it before our users do.
Over the last couple of months we’ve added a ton of metrics to improve insight
into all parts of Travis. But during these months, we couldn’t find the single
metric that would tell us if the system is doing what it’s supposed to do, which
is of course to run your builds. It took us quite a while to finally figure out
how to measure something that doesn’t happen. That caused me quite a headache,
even though, in hindsight, it was so obvious.
Just last week, we had three unavailabilities due to networking issues on EC2
and two DDoS attacks on GitHub. Earlier this week, EC2 crapped out once again,
taking part of our infrastructure with it.
There was a difference with all these outages. Even though there wasn’t much we
could do about them, this time we were alerted about them well in advance. Fun
fact: we found and added the metric that defines whether or not Travis is running
properly. As embarrassing as they were for us, at least we knew about them when
they were happening.
Enough blabber, what’s the metric already? After getting repeatedly notified by
users that builds are not being run, it finally hit me one day. The simplest
metric that we can track that shows us how the system is doing is the time since
the last build started.
Yes, it turns out to be that simple. Turns out that this it the sole defining
metric that helps us keep a watchful eye on Travis. Just to be safe, we added
the time since the last build finished. As a general metric we’re also tracking
the number of message currently ready to be consumed in RabbitMQ. These metrics
give us a rough clue that something is failing in our infrastructure. Here’s a
recent snapshot of what they look like when correlated:
Here’s a more recent graph that shows a database latency spike not long ago and
queues backing up as a consequence. We’re still investigating why this happened,
and we’ll move to a bigger database setup soon as well. We’re also spreading out
the work load even more to keep up with it better.
How can I find my soul metric?
Why did this take so long to figure out? The most common question I get from
folks is what kinds of metrics they’re supposed to track for their application.
Unfortunately, there is no obvious answer here. If you have a simple web
application, your most common nominator is the number of web requests, and
the response time.
If you have an app that sends a lot of email, your metrics could be the amount
of email being sent, time of an email spent in the delivery queue, time of
network requests to remote email servers, file system utilization. Your core
metric would probably still be the numbers of email sent. If email is being
sent, the system is in a nominal state. If no email is sent, something is likely
to be wrong. Add the number of emails waiting in the queue and you have data to
correlate with.
Sometimes your core metric just isn’t obvious in the first place. For us, the
metric only became obvious after we realized that what users would mostly report
to us is that there haven’t been any builds running for several hours.
In Travis, every component has its own core metrics. For instance, we have a
process that processes the build logs. From above, the most important metric is
the number of log messages waiting to be processed. To be able to track this, we
recently started collecting more detailed metrics for every single queue in
RabbitMQ.
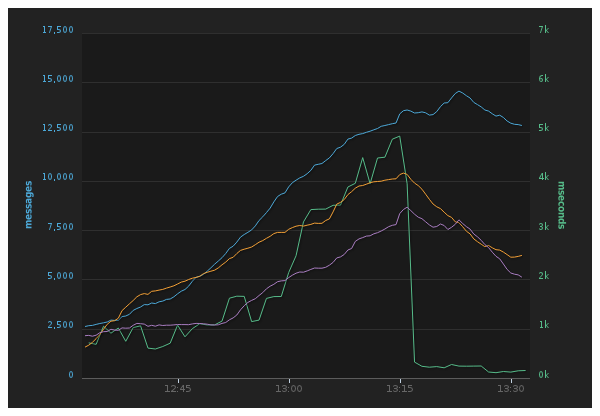
On Tuesday morning, when EC2 was still having issues, we noticed that log
processing was way behind. Thankfully, we had a second metric in place to track
the averages and 95th percentiles of ActiveRecord updates. Lo and behold, the
95th percentile for these went through the roof, up to 6 seconds for a single
write to the database. Another fun fact: the metrics for single queues was just
added the day before. In fact, I put them in production when the troubles
started and our alerts immediately went off. Here’s something visual that shows
the latency spiking and the number of messages queueing up in our logging
queues as a result:
Notice the latency going up (green graph) and messages piling up. Suddenly the
latency went back to almost being normal, and the queues were slowly drained.
Finding your soul metric can take time. But in the end, it boils down to what
matters most to your users. What’s most valuable to them can easily turn into
exactly what you need to track to figure out if, from the user’s point of view,
everything is still working.
To track custom, external metrics like the ones from RabbitMQ or determined by
database updates, we built a small monitoring app based on Celluloid. It polls
data sources every 20 seconds and pushes them directly to Librato
Metrics.
As these metrics are critical to running the platform, a resolution of 20
seconds is pretty good, though we might take them further down to 10 seconds in
the future.
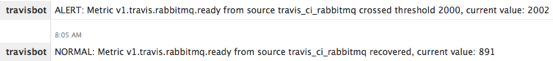
That little app also does threshold-based alerting to our Campfire room. I’m
planning on adding support for Pagerduty and Prowl soon too.
While there are existing tools for monitoring, metrics collection and alerting,
there’s no shame in experimenting with your own, if you’re aware of the
downsides. Monitoring mostly still sucks, to get better, more people need to
play with more ideas.
If you want to chat monitoring and metrics, Travis or coffee, I’ll be in NYC
next week for devopsdays.
If you think about Travis CI, the web client is the face of the project. You
look at it a lot.
The “live” nature of our UI, updating the repository timeline as new builds
come in, streaming the logs to the browser while a test suite is being run,
updating job queue etc. has always been a great asset for Travis CI.
People just love it:
… and the “Mac OS X style desktop application” metaphor has proven to work
quite well over time.
At the same time we are all aware of the issues that our client had over the
last few months, especially since traffic on Travis CI has exploded.
We are now running about 10,000 builds a day for nearly 25,000 repositories and
our old client could just not hold up with that. Especially in situations where
our queues had run full and other, seemingly “unrelated” issues occured and the
whole client just stalled on Chrome.
On top of the scalability issues our codebase made it pretty hard to fix things
and add new features. Instead, one had to fight with really old library versions
that could not be upgraded easily, a ton of work-arounds and even things like a
slow asset compilation pipeline.
Even though the client as such was still great, people became increasingly
unhappy with the issues it started to show. And rightfully so. We felt just
the same!
So today we’re really happy to announce Travis CI’s next generation
web client.
The next generation web client
The new Travis CI web client is a complete reimplementation of the proven
feature set of the last version. Development started four months ago
and a huge amount of work has been put into it over the last few months.
It is currently running on
https://next.travis-ci.org and we will keep the
old version running on http://travis-ci.org for a short
while until the new one has proven under higher load and remaining issues are
hashed out.
New features
With this new version our main goal was to reimplement the same, well known
and battle tested functionality that the old client had, but make it based
on the latest versions of ember and ember-data, improve its performance,
overall stability and usability.
We are very happy that this goal has been achieved. The new client feels
much more snappy and performs quite well even in situations where our queues
see lots of traffic and start backing up.
Still, we also were able to put in some goodies and new features:
No more hashbang URLs, finally
We have never been very religious about this but there always were good
arguments that made us want to move away from the hashbang URLs that Travis CI
has started with (and frankly, worked great despite using them).
With the move to the new, shiny Ember router and the new API endpoint there
was no reason to stick with them and we changed our URL scheme to plain,
simple (and some would say “non-broken”) URLs:
Requeue builds button
This is probably one of the most requested features recently: a way to
re-trigger a build through our UI. This will come in handy if you have a build
that stalled or misbehaved for some reason and you want to re-run it:
Flash messages
If you use that feature you will also notice that we also finally have a
generic way of displaying flash messages:
This yet has to be used for other interactive features such as turning
service hooks on/off and synchronizing data from GitHub.
Design details
We have also put in a significant amount of attention to further iterate on
the look and feel.
Especially when running on smaller screens the old client was not really great
to use. We have now tweaked font sizes, widths and margins and made good use of
css media queries to respond to different screen sizes gracefully.
Even though this can still be improved (especially for very small screens, we
will happily accept pull requests) we believe it’s a huge improvement:
Other design touches
The profile page (now renamed to “Accounts”) got a complete overhaul:
If you’re into CSS then you might notice that the service hooks on/off
switch is done entirely in CSS without using any images.
The somewhat weird behaving and flickering feature that displayed repository
descriptions when mousing over a repository entry in the left sidebar has been
replaced by an “Info” button which reveals all repository descriptions:
We have also ressurected the long buried selection indicator for the
repository list on the left as well as the accounts list on your profile page.
And one can now expand and collapse all workers in the right sidebar with one
click:
And finally there’s a more generic way to display popups:
Coming to Travis CI Pro soon
We already prepared integrating this client for Travis CI Pro so you can expect
it to be ready soonish.
Travis CI Pro is still in private beta, but if you are interested in trying it
out then drop us an email to support@travis-ci.com.
Thank you, Ember.js!
The new client is built on top of the latest version of
Ember.js, instead of the pre-alpha Ember version that
actually still was called Sproutcore 2.0 at that time. It uses the much faster
and lighter Ember Data for storage, instead
of the old and very, very crufty Sproutcore Datastore. And it uses the new,
shiny Ember Router, not our own port of the old Sproutcore router.
All the improvements that have gone into the underlying Ember libraries
combined with the removal of hackish workarounds on our side make up for
tremendous improvements not only in terms of speed and stability, but also ease
of development and way more consistent code everywhere.
Engine Yard has always been a great supporter of open
source, the Ruby ecosystem, and Travis too. So today we’re thrilled to
announce that Piotr Sarnacki is being sponsored by
Engine Yard to work on Travis CI.
Piotr is a Rails contributor, he’s made Rails engines
awesome and,
depending on the angle, he looks a bit like Nicolas Cage.
Engine Yard have been avid supporters of Travis already, having joined the ranks
of sponsors during our Love campaign. Now they’re
enabling us to push Travis further and bring more goodness to the open source
community!
With the sponsorship, Piotr joins the Engine Yard OSS Grant Program.
Already, he’s built support for secure environment variables, allowing you to
store important credentials in your .travis.yml securely.
Recently, he’s been putting a lot of great work into our new user interface, now
fully based on Ember.js. Expect a blog post on it very soon!
Welcome to the team, Piotr. And thank you so much for the sponsorship, Engine Yard.
We’re looking forward to seeing more goodness being shipped soon!